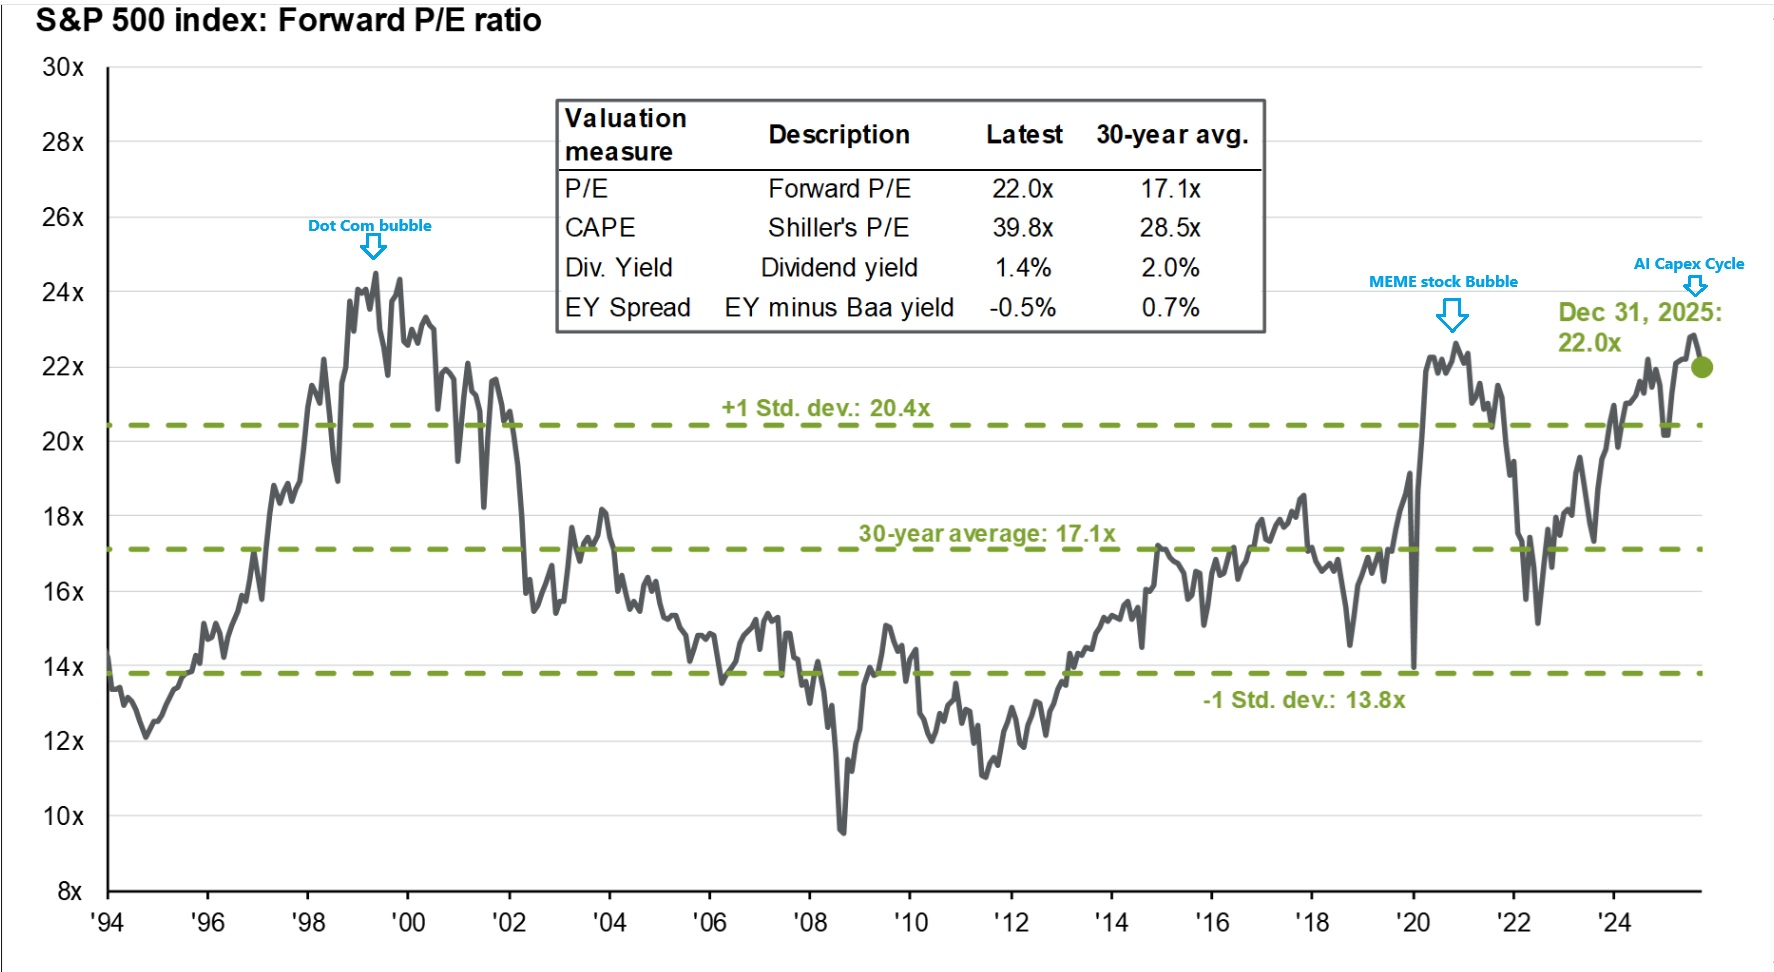
Equity Risk Premium

Daily Calculated Spread (Earnings Yield - Risk Free Rate)
Loading...
Expensive (-2%) Fair (3%) Cheap (8%)
Historical Avg: 3.2%
S&P 500 Earnings Yield --%
10-Year Treasury Yield --%
Text commentary last updated January 12, 2026.

Why is this important?

The Equity Risk Premium (ERP) represents the excess return that investing in the stock market provides over a risk-free rate (typically the 10-Year Treasury). This is a fundamental metric for valuation at the index level.

What is occurring?

The spread has turned negative denoting very expensive valuations. Note that this model relies on trailing earnings without dividends, making it a backward-looking diagnostic. While useful for historical baselines, see below for a comprehensive, dividend-adjusted view.

Critical Watch Level 10Y Yield > 4.5%

The Comprehensive ERP Model

Data sourced from NYU Stern School of Business
Signal: Caution
Updated: January 12, 2026

Synopsis:

I have created a visual to show where the ERP (Blue line) ends the year and how it correlates to the next year's S&P 500 returns. The higher the ERP the better the returns tend to be. We can see in the modern era ( The last 20 years) Valuations have been range bound between 6%-4% ERP.

During the Dotcom bubble, the ERP fell to very low levels falling to a low point at 2.05%. So it is plausible that elevated valuations can persist in shorter time frames. However, once these periods end, market valuations will mean revert. From the close of 1999 it took the S&P approxiately 7 years to make new highs.

Forward Looking Measures

S&P 500 Forward Price to Earnings Ratio (data from J.P. Morgan)
Signal: Expensive
S&P Forward Valuations
Updated: January 10, 2026

What is occurring?

This chart shows a one standard deviation move over/under the 30 year average forward earnings multiple for the S&P 500. The current forward P/E ratio for the S&P 500 is stretched against historical precedent. The only other period where the forward P/E traded at a higher ratio, near 25x forward earnings, was in late 1999. The most recent occurrence where the index traded over 22x forward estimates appeared in late 2021 in what I have dubbed as the "MEME" stock bubble.