Executive Summary
- The oil futures curve has already pre-traded a clean Strait of Hormuz reopening — front-month near $87, December near $78. The "relief rally" everyone is waiting for on a ceasefire has, in large part, already happened.
- A 60-day ceasefire or MoU leaves the Iranian regime in control of the strait. War-risk insurance does not return to pre-war levels on a temporary pause — the chokepoint premium becomes structural, exactly as Red Sea / Suez transit never normalized after Houthi attacks abated.
- What the market is counting as "demand destruction" is mostly involuntary supply rationing — cancelled flights, unavailable product — not consumers changing behavior. Latent demand survived the war in suspension. Government fuel subsidies and gas-tax holidays have actively blocked the price signal that would destroy it.
- The 2022 de-escalation valves are spent: the SPR sits near multi-decade lows and is being loaned, not dumped, and there is no new shadow fleet to conjure — the Iranian barrels that were the shadow supply are the ones now removed. The floor under this crisis sits structurally higher than Russia–Ukraine despite a lower headline price.
- The trade: buy the dip in energy — XLE — on any deal announcement. The fracture signal: a US recession that converts suspended demand into permanent destruction.
The standard playbook says a ceasefire crushes oil and you sell energy equities into it. We think that playbook is looking in the rear-view mirror. The bearish catalyst — reopening — is already embedded in a backwardated curve, while the bullish reality — a structural physical deficit that persists for months past any deal — is not. When the news everyone is positioned for finally arrives, there is no premium left to release. Physics reasserts. That asymmetry is the trade.
Theme 1 — The Deficit Persists Past the Deal
The IEA's May balance is unambiguous, and the crucial detail is that its base case already assumes the conflict ends by early June. Even with that ceasefire baked in, the market remains severely undersupplied through the end of 3Q26. Supply does not catch up with demand until October. The cumulative liquids deficit builds toward roughly 900 mb by September — and that is after netting in the IEA's 400 mb coordinated release, which only reduces the draw on industry stocks to ~500 mb. A ceasefire does not fix the deficit in this chart, because the chart is what the deficit looks like with the ceasefire.
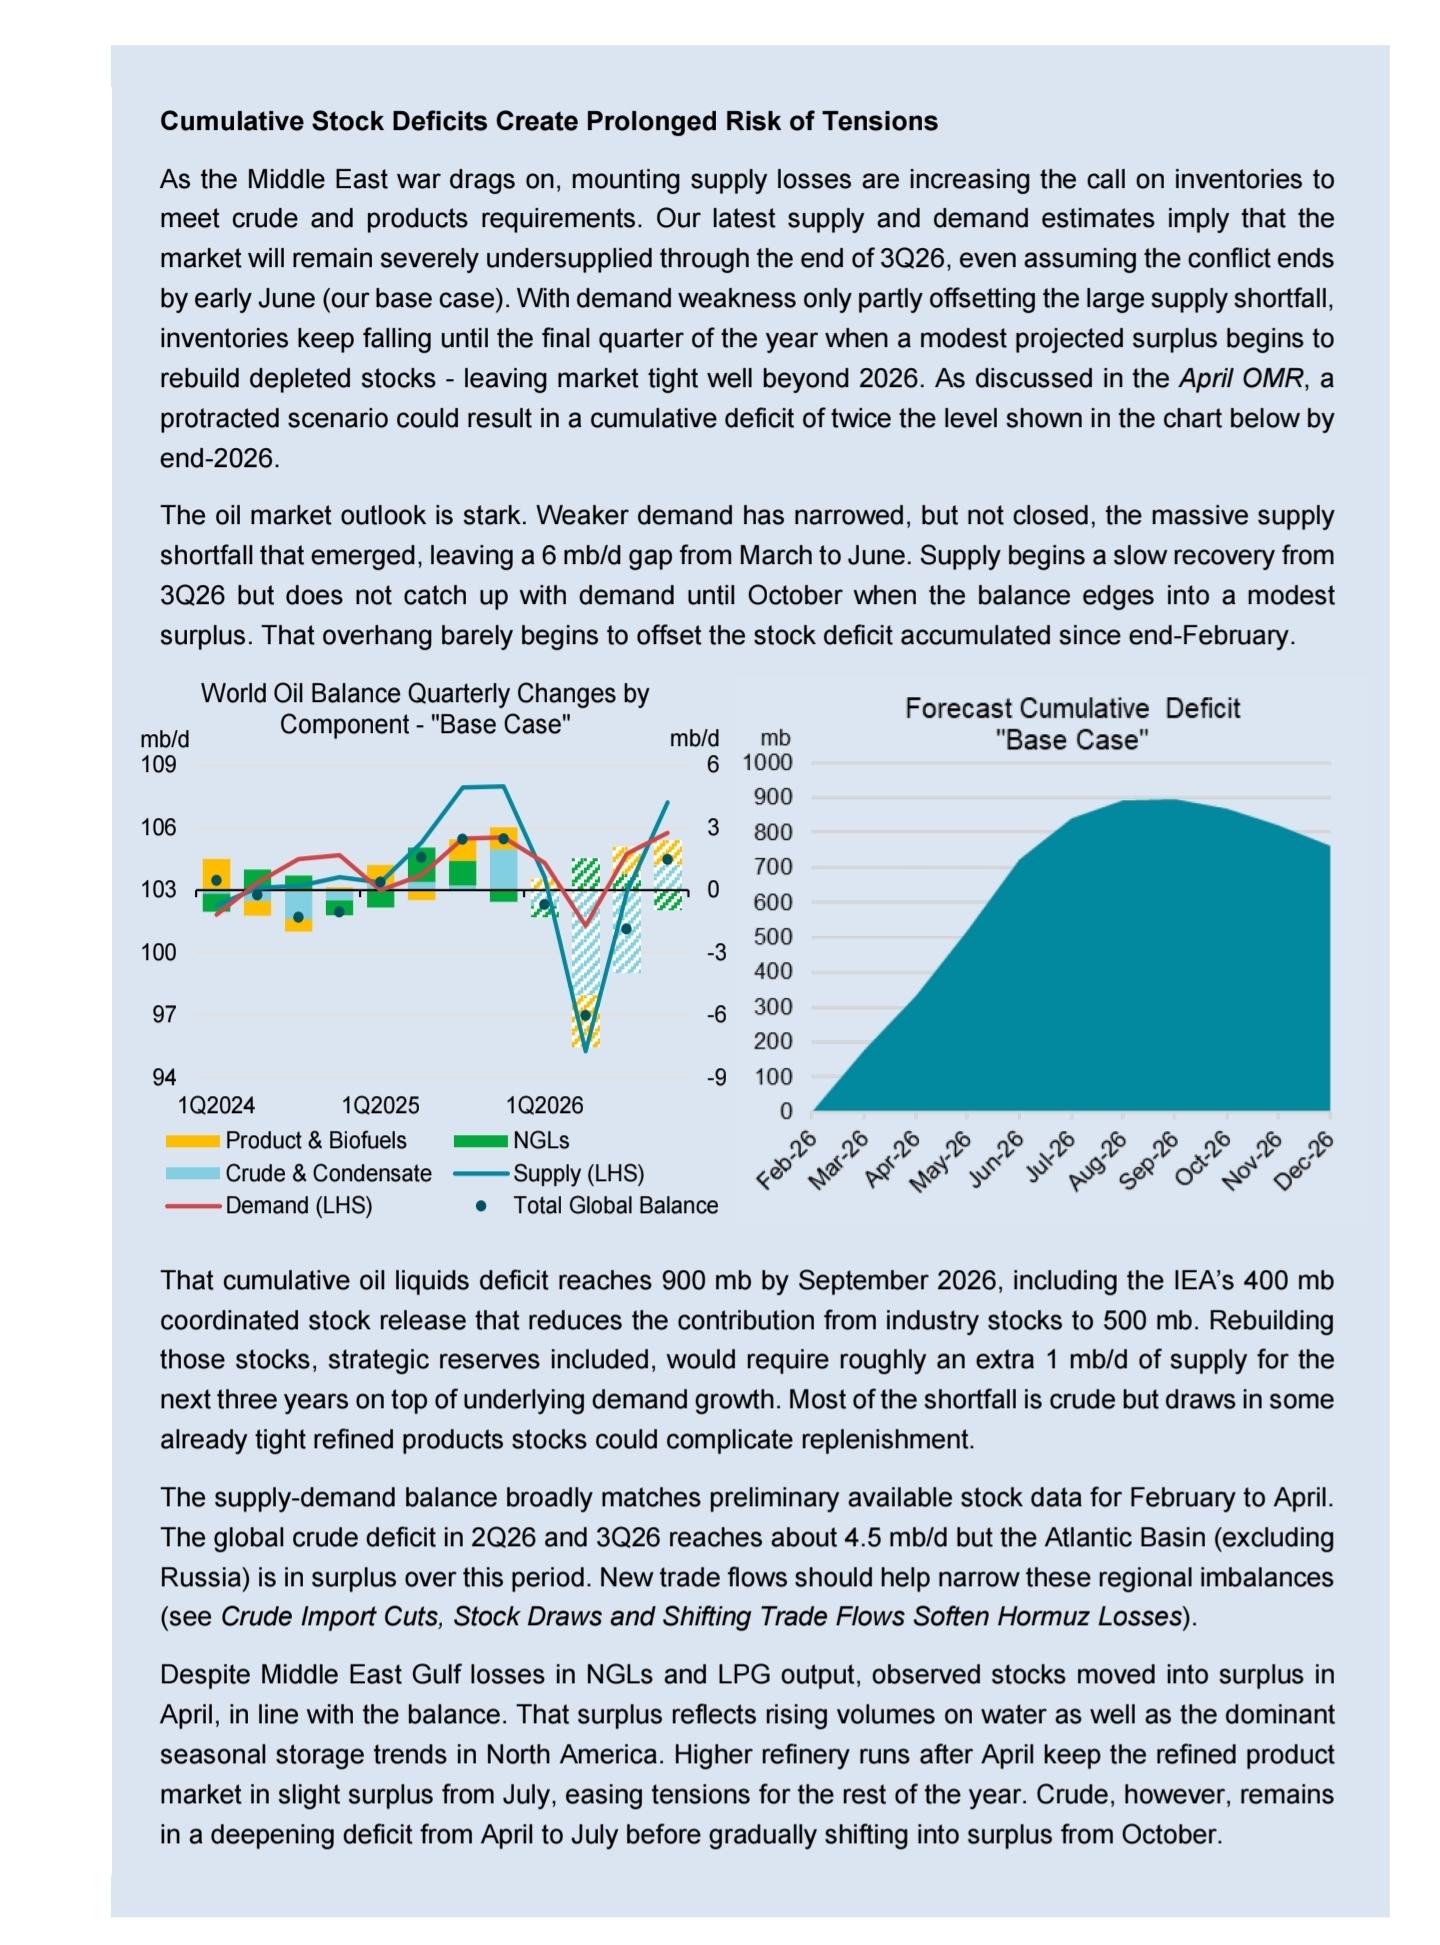
Rebuilding those stocks — strategic reserves included — would require roughly an extra 1 mb/d of supply for the next three years on top of underlying demand growth. That is not a market that returns to neutral after the war. It returns short, owing itself years of refill demand. The refill obligation is a structural bid layered under the back of the curve through the end of the decade.
Theme 2 — The Draw Is Real and Visible
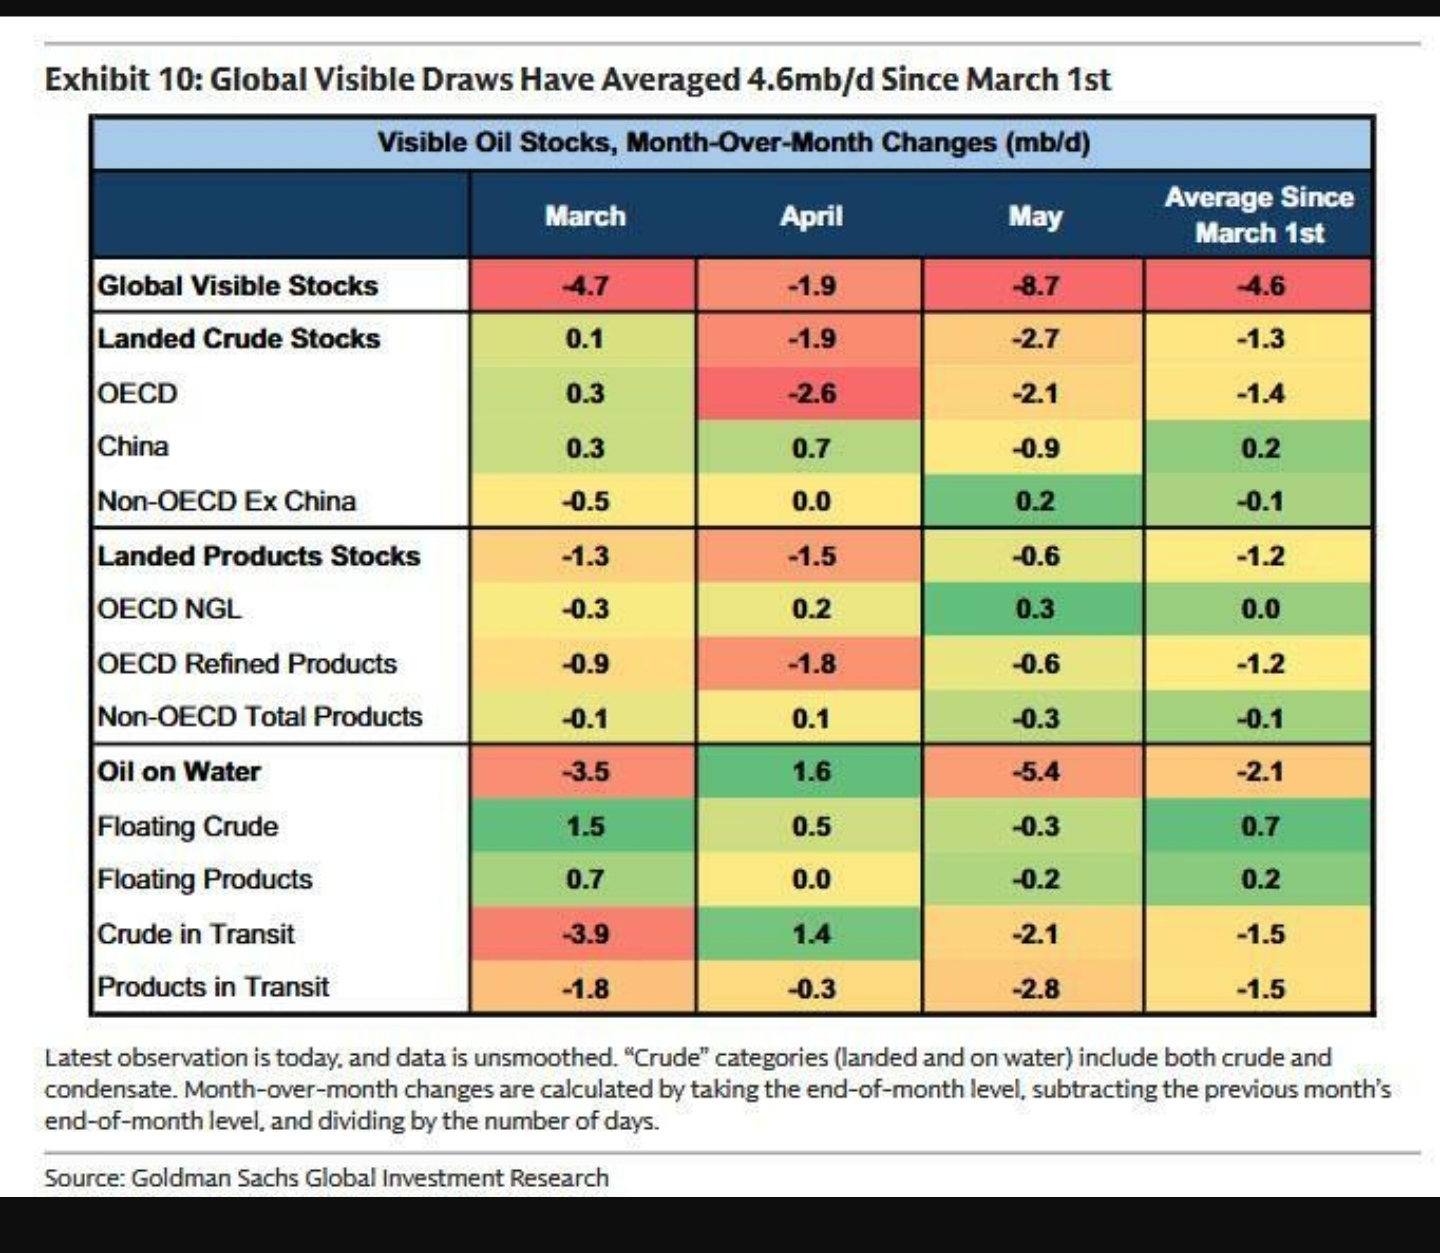
This is not a forecast that can be hand-waved away as a modeling artifact. Goldman's visible-stock data shows global draws averaging 4.6 mb/d since March 1 — and accelerating, with May running at -8.7 mb/d. The barrels meeting current consumption are not coming from new production; they are coming out of tanks. That is, by definition, a finite mechanism with a deadline.
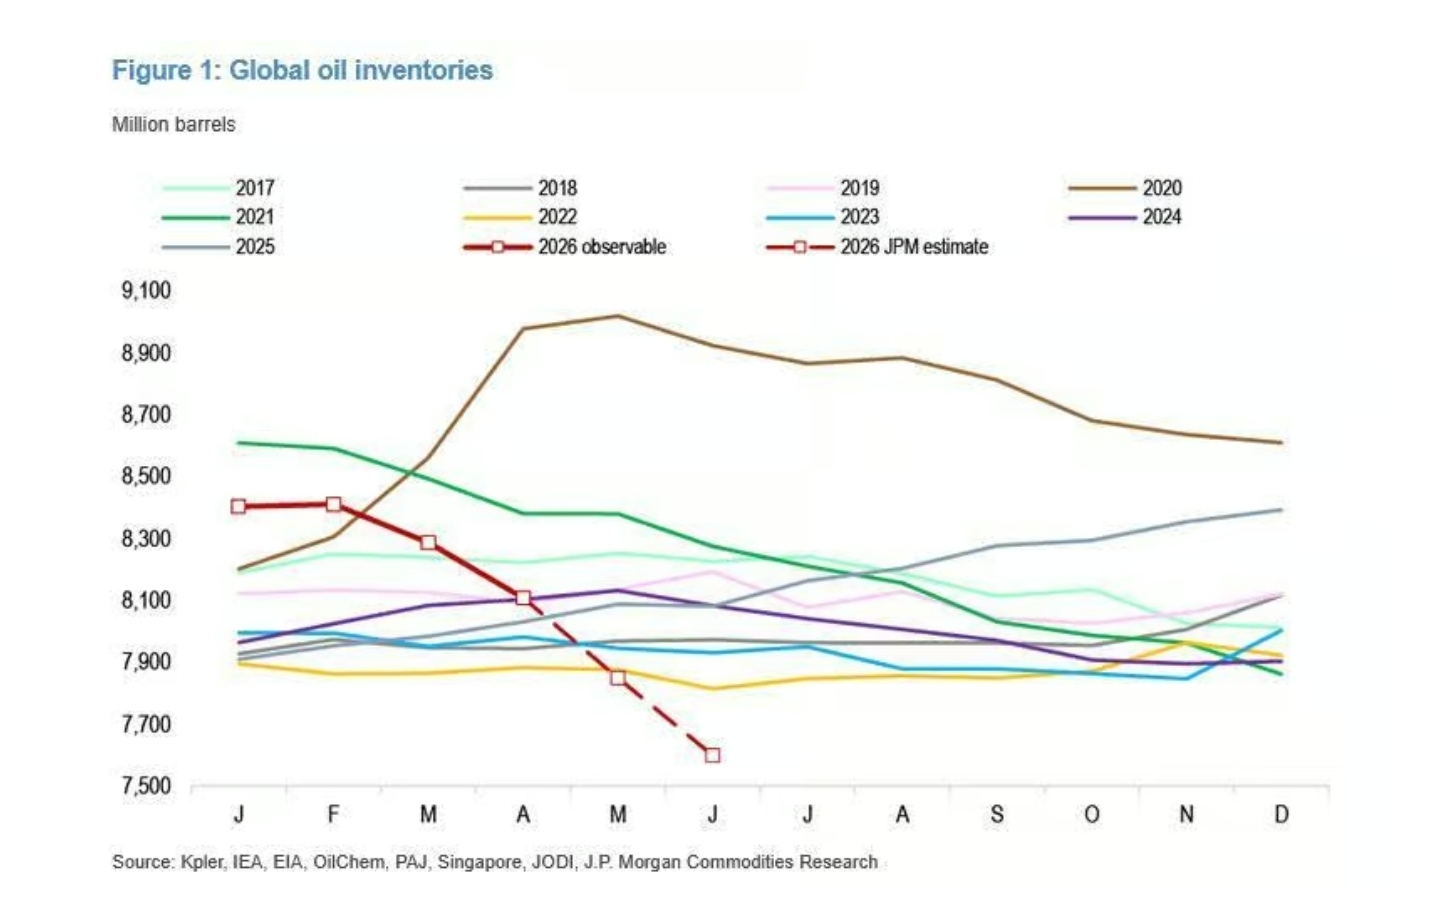
JPMorgan's inventory series puts the same story in levels. The 2026 observable line breaks decisively below every comparable year and the JPM estimate path drives it lower still into mid-year — a near-vertical descent away from the 2017–2025 cluster. The world is not running a normal seasonal cycle; it is drawing down the buffer that the curve assumes will still be there.
Theme 3 — The De-escalation Valves Are Spent
The argument that this crisis is structurally firmer than Russia–Ukraine rests on what brought 2022 prices down from their highs: a record ~180 mb SPR drawdown, and the gradual rebuild of sanctioned Russian barrels into the market via a newly enabled shadow fleet. Both of those valves are weaker or absent now.
The SPR enters this war near multi-decade lows — and critically, it is being loaned, not sold. Under the exchange, companies borrow crude now and return it with an 18–22% in-kind premium in tranches running from late 2026 through 2028. That structure deliberately defers the supply relief's cost into future buy-back demand — it is not the open-ended price cap 2022 had. And there is no new shadow fleet to summon, because the Iranian barrels that were the shadow supply are precisely the ones now removed from the market.
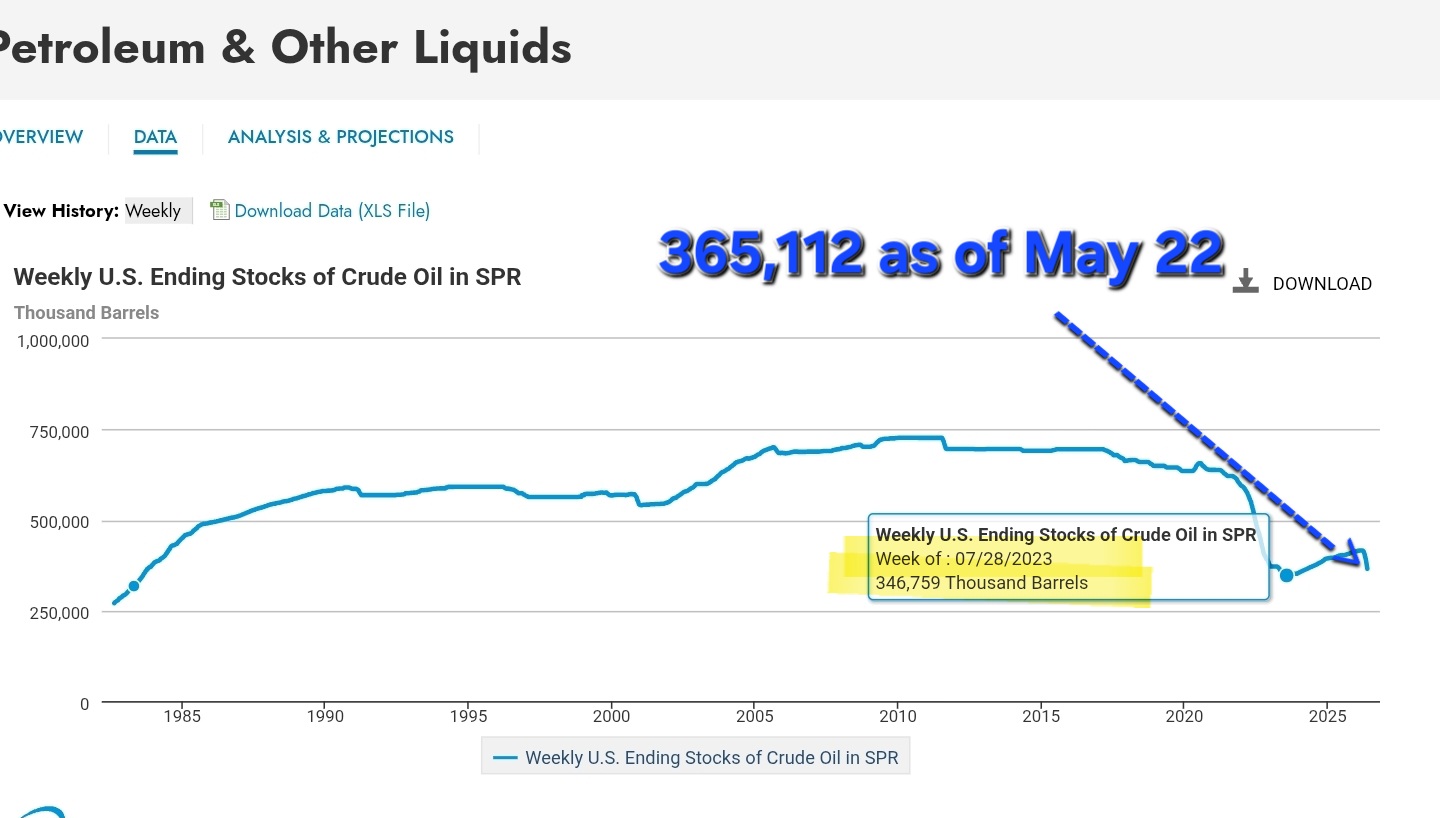
The implication: a lower headline price (~$87) than the 2022 peak (~$120) does not mean a lower floor. With the tools that de-escalated the last crisis exhausted, the floor under this one sits higher, not lower.
Theme 4 — Demand Destruction Has Not Happened Yet
This is the crux, and where consensus is most wrong. The IEA's observed demand drop is being counted as banked demand destruction. It is not. Cancelled flights and disrupted LPG deliveries are involuntary supply rationing — the consumer was prevented from consuming because the product or the flight was removed. That is categorically different from the behavioral, voluntary cut that "the cure for high prices is high prices" describes. The latent demand did not die. It is dammed up behind the physical constraint.
And the dam has been actively reinforced. Government gas-tax holidays, fuel subsidies, price controls, and physical shut-ins all sever the price signal before it reaches the consumer. If the pump price never reflects ~$87 crude, the consumer never gets the message to cut back. More fiscal response here is not a stabilizer — it is an accelerant. A subsidy is fiscal demand creation layered onto a supply-constrained market: it protects the very demand that is causing the shortage, widening the physical deficit for any given price. You can print money to subsidize demand; you cannot print barrels to meet it.
So the sequence the market has backwards: it believes demand destruction is banked and supply relief is coming. We believe demand relief comes first — latent demand released into a still-deficit market on a deal — and real destruction is still months away, arriving only once the price is finally allowed to rise high enough to force it. The deal is the trigger for higher prices, not lower.
The Chevron Tell — Physical vs. Priced
The clearest corroboration from inside the industry comes from Chevron Chairman & CEO Mike Wirth, who has spent the war repeating a single message: the futures curve is disconnected from physical reality. Speaking at CERAWeek, Wirth said there are very real physical manifestations of the Strait's closure working their way through the global system that he does not believe are fully priced into the futures curve. He framed the market as trading on "scant information" and perception, while the physical supply of oil is materially tighter than the contracts suggest — explicitly noting that this time is different from prior incidents because so much oil and gas is simply not flowing.
Wirth has also made the demand point directly: he has warned that economies "are going to have to slow" as physical shortages appear — Asia first — and that the surplus commercial supply, shadow-fleet tankers, and national strategic reserves were all being absorbed. He has compared the scale to the 1970s shocks. On jet fuel specifically, he flagged that roughly 75% of Europe's imported jet fuel normally comes from Middle East refiners and is not flowing, so aviation gets worse before it gets better. That is the supply-rationing-as-demand-destruction dynamic described from the operator's seat: demand is being throttled by physical unavailability, not by consumers choosing less.
The market's response to Wirth is itself the tell. On the day oil fell more than 10% on a Trump "I want a deal" headline, CVX traded up. Energy equities sniffing higher while crude sells the war-end narrative is exactly the signature this thesis predicts: smart money positioning for the physical deficit the curve is ignoring.
Chaos Theory Outlook — The Trade
We are buyers of energy on weakness, and specifically buyers of any sell-off triggered by a ceasefire or MoU headline. The vehicle is XLE — the broad US energy sector ETF — which gives diversified exposure to the integrated majors and large-cap E&Ps (Chevron and Exxon among the top weights) without single-name headline risk. The logic: a deal removes a premium that is already largely out of the curve, while leaving intact a physical deficit that runs to October, a refill bid that runs for years, a chokepoint insurance premium that a 60-day pause cannot normalize, and a reservoir of suspended demand that fiscal policy has prevented from clearing. The textbook "sell the reopening" reaction is the dip we want to buy.
The signature to watch in real time: on a deal headline, watch whether the front of the curve rises toward the back rather than the back collapsing toward the front. Front-month strength on ostensibly bearish ceasefire news is the market confirming that latent-demand return is outweighing supply relief — the green light for the trade.
What Fractures This Trade
The thesis is a supply-side floor argument, and its single point of failure is the demand side: a US recession. Everything above assumes suspended demand is latent and will return when the physical constraint lifts. A recession converts that suspended demand into permanent destruction — the cancelled trip never gets rebooked, industrial load finds permanent substitution, and the deficit closes from the demand side faster than the IEA models, well before supply recovers. In that world the floor gives way, the curve's bearish read is vindicated, and energy equities de-rate with the cycle. Watch US labor data, commercial inventory draws stalling out, and consumer fuel demand cracking even with prices suppressed — if the draw slows while subsidies are still in place, demand is breaking on its own and the trade is off. Sustained crude at or above current levels is itself a recession accelerant, so this risk is endogenous, not external. Disclaimer: Statements about prices, levels, and market conditions are as of the publication date and are forward-looking opinions that may prove incorrect; no outcome is guaranteed and past performance does not indicate future results. Information is drawn from third-party sources believed reliable but is not guaranteed to be accurate or complete, and the author has no obligation to update it.